Suggested Searches

Water Calculator

Santa Clara Valley Water District

scw scw-hero.

To get a better handle on how much water Ssanta Clara Valley residents were using, we built a water-usage calculator on the Save20gallons.com site to give them an idea of their usage.

I took that concept and went the next step and mapped out how a more robust vesion of the calculator could help residents get a more granular and accurate look at their water usage behaviors..

calculators

Research

I looked at calculators from here in california, to netherlands, saudi arabia, etc… the main concern I saw was that the final result a user gets was pretty superficial. a list of tips and an estimated range of usage.
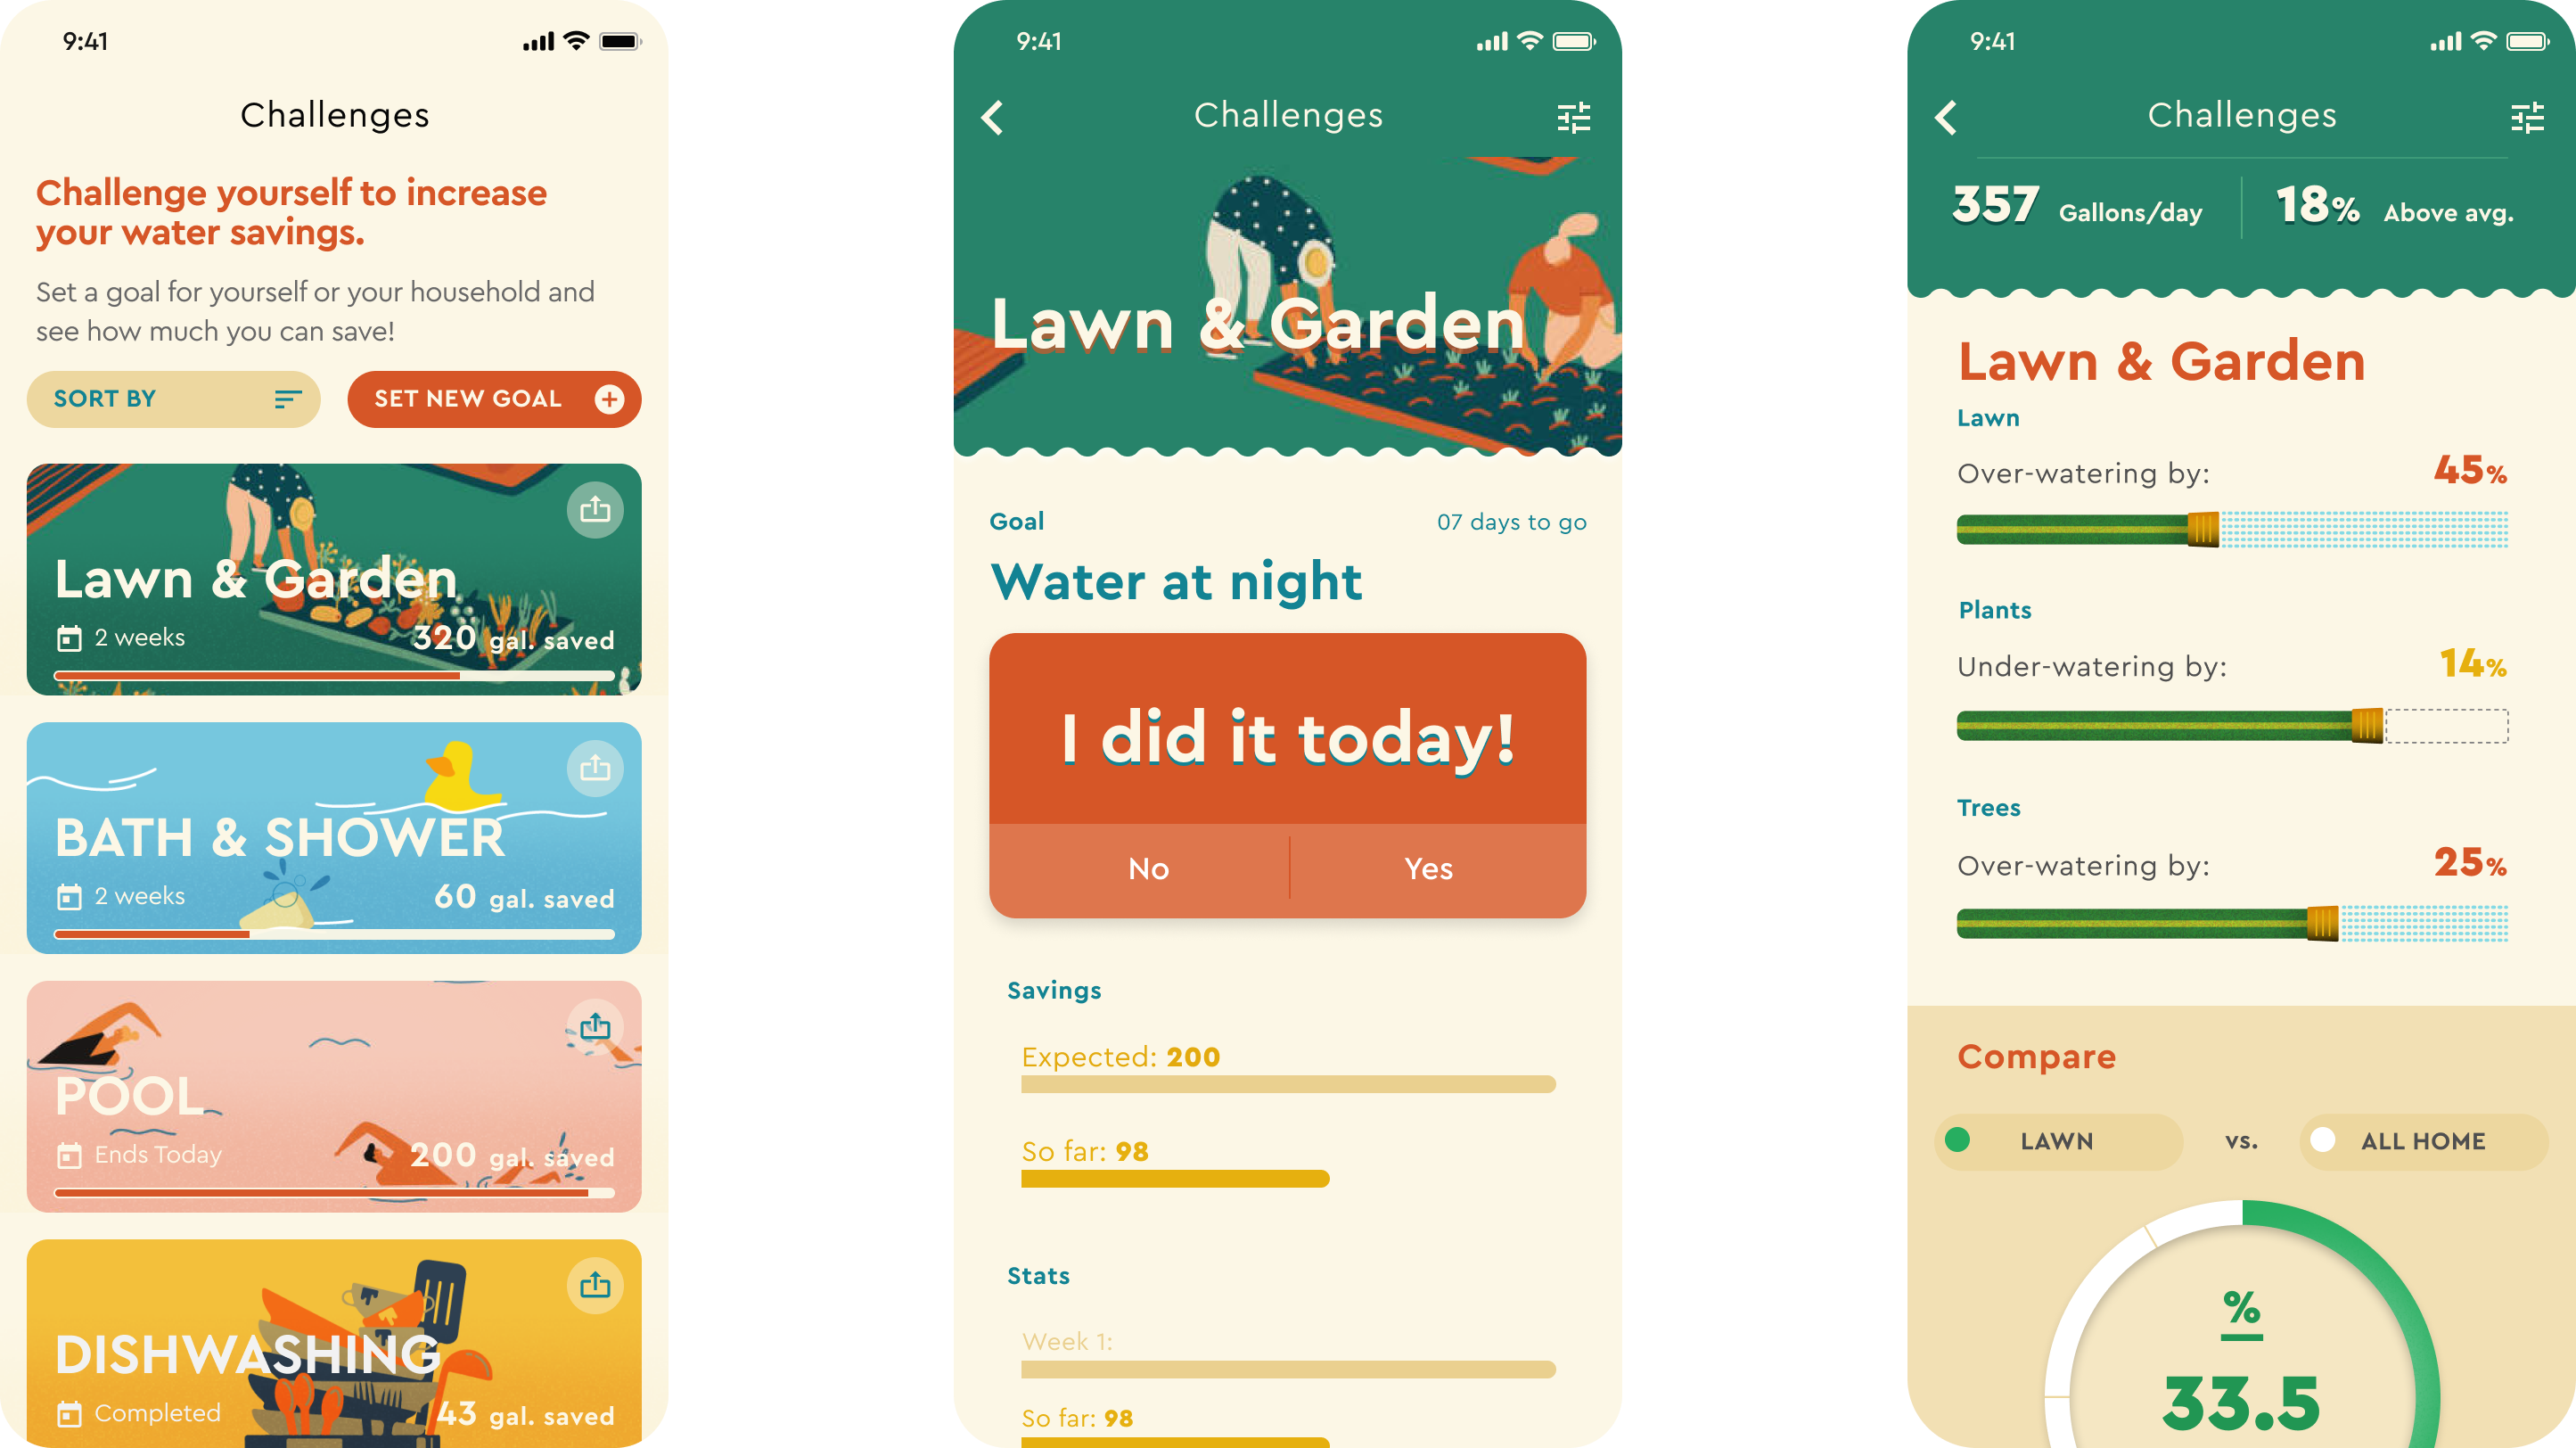
UX

When constructing the experience, I sought to allow user to get better insight by putting them to task. The calculator urges users to really look at their water usage. A little work goes a long way to truly understanding actual water usage; and in turn empowers users to cut consumption.

Care Direct

Set up

Users input the details of their home and awater usage. This allows the calculator to establish a baseline to compare future usage against The home is divided up into four major areas; each area is further subdivided by tasks that commonly take place in these areas. For example, the bathroom can include: showers, toilet use, various sink activities such as hand washing and teeth brushing. Users can track all or some of the taks.

Aggregate usage data adds value to users efforts by showing progress over time.

Tasks such as brushing teeth, washing face, washing hands, toilet flushes, showers, etc. can be tracked individually for a more granular estimate of water usage. Users can explore a detailed log of their usage and see it visualized in a graph that can be adjusted to see diffent timespans.

Voice activated timer

To track a more exact amount water usage, for example, in the shower, the user simply says "start" and the timer begins.

A water-wise user will say "Pause" as they turn the water off while lathering up.

Finally, they shout "Start" again as they finish rinsing off. Allowing the calculator to record a more accurate usage—and it keeping their thousand dollar phone dry.

Area overviews.

An combined visualization of a water usage for all tasks belonging to a given area (e.g.: Bathroom) is an easy way for users to see their over-all behaviors in an area. All areas of the home are represented; a more detailed representation broken down by tasks can be accessed by clicking 'view details.'

If a user is part of a group, visualizations of that data is accessed in the 'Groups' page. Only aggregate data will be visualized.

graphs

Groups & challenges.

Groups can be set up to track the over-all usage within a home. The whole house can get involved by tracking their usage independently, everyones' results are combined to show hosehold savings. Users can still see their personal contributions.

While challenges were not ultimately implemented, the idea was to to prompte users to set savings goals based on the savings-areas.

Users can join challenges that are pre-set or create their own. Each challenge requires a time limit, and a goal in gallons to set up.

Users update their progress through check-ins, which makes for a tangible way to keep water savings top of mind.

challenges.